Disclaimer: The opinions expressed here are for general informational purposes only and are not intended to provide specific advice or recommendations for any specific security or investment product. You should never invest money that you cannot afford to lose. Before trading using complex financial products, please ensure to understand the risks involved. Past performance is no guarantee of future results.
In this article, we’ll be exploring what the Rate of Change (RoC) is, what it measures, common uses and how it can be applied to Tuned and algorithmic trading in general.
Table of contents
- What is the Rate of Change indicator?
- How is the Rate of Change calculated?
- Common uses
- An example strategy using RoC on Tuned
- Conclusion
What is the Rate of Change indicator?
The Rate of Change (RoC) is an indicator that measures momentum. We haven’t found reliable sources indicating its original author and creation date, but the consensus points to its creation in the early 2000s.
It measures momentum by calculating the percentage difference in price between the current price and the price n candles ago.
RoC is an unbound indicator due to, theoretically, having a lower limit at -100, indicating the price fell to 0, but no upper limit.
It’s categorized as an oscillator as it’s usually plotted against a horizontal line at exactly 0, with the RoC value oscillating between the upper (positive) and lower (negative) areas.
- A positive RoC signals that the price increased compared to its value n candles ago;
- A negative RoC signals that the price decreased compared to its value n candles ago;
- A RoC of 0 signals that the price is exactly the same as it was n candles ago.
How is the Rate of Change calculated?
The formula for calculating the RoC is the following:
ROC = ((Close – Close n candles ago) / (Close n candles ago)) * 100
Common uses
As RoC purely measures momentum, Traders quote usefulness is mostly seen as a filter or confirmation signal. Deriving primary signals is difficult without the confluence of other technical indicators. One of its major utilities is being able to indicate divergences, overbought and oversold areas; these are plotted as spikes out of the average range in either direction. Summarizing, the RoC helps you:
- Identify oversold and overbought areas;
- Refrain from trading if there’s a lack of momentum;
- Validate a signal by using RoC for confluence.
An example strategy using Rate of Change on Tuned
The code is as follows:
Tuned Script
<sup>//Inputs
RocLength = intInput("ROC Length",6)
BuyThreshold = numInput("ROC Buy Threshold", -4.0)
SellThreshold = numInput("ROC Sell Threshold", 4.0)

//indicator
ROC = roc(close, RocLength)

//Conditions
buy = lt(ROC, seriesOf(BuyThreshold))
sell = gt(ROC, seriesOf(SellThreshold))

//Plot
plot(ROC, "Rate of Change", "#FF1500", 2, PlotStyle.LINE,3, false)

//Signal Push
out(signalIf(buy, sell))</sup>
Pine Alpha
<sup>//@version=4
strategy(title="Rate of Change", overlay = false)
//Inputs
ROCLength = input(title="ROC Length", defval=6)
//Indicators
ROC = roc(close,ROCLength)
//Plots
plot(ROC, "Rate of Change", color.green)
//conditions
go_long = ROC < -4.0
go_short = ROC > 4
//Entry
strategy.order("long", strategy.long, when=go_long)
strategy.order("Short", strategy.short, when=go_short)</sup>
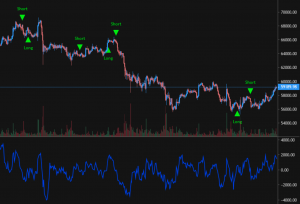
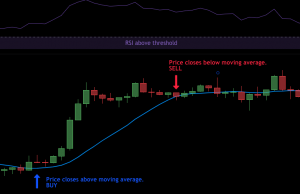
For demonstration purposes, a strategy was coded with the following parameters:
- RoC Length = 6;
- Long when RoC < -4;
- Short when RoC > 4;
- No Stop Loss, Take Profit or close logic.
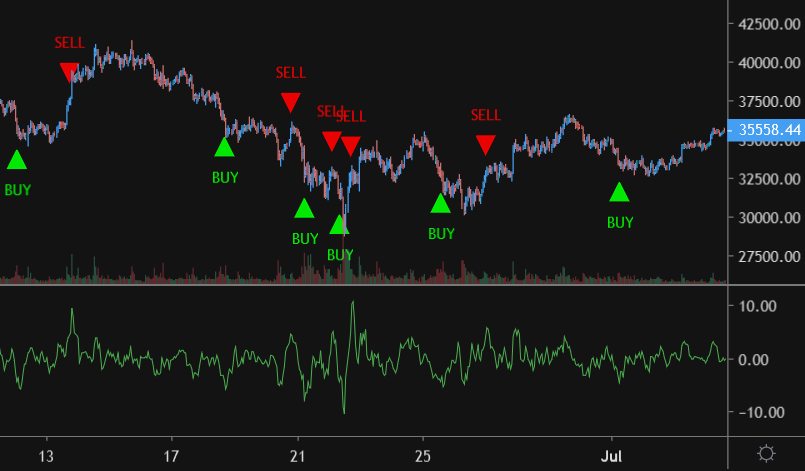
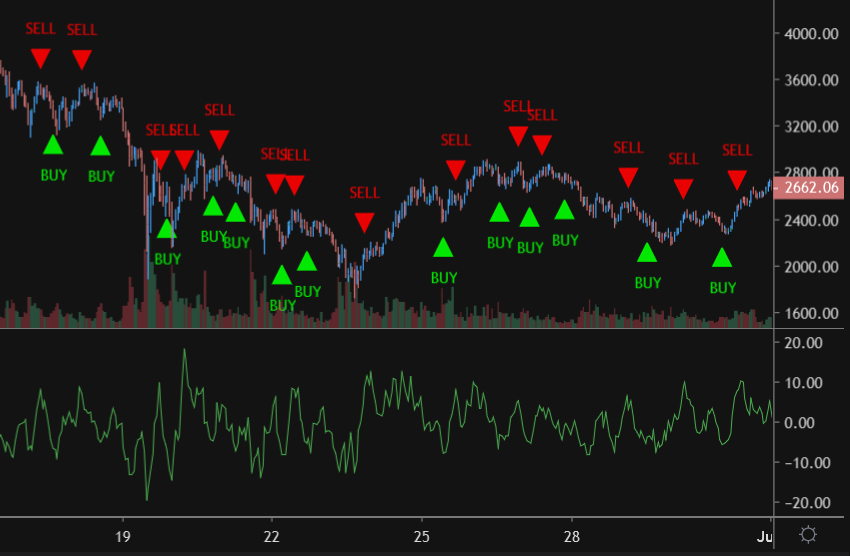
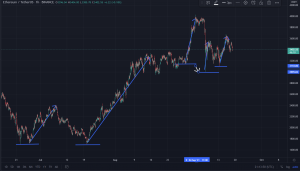
How does it behave?
- In trending markets, this strategy will abstain from trading, possibly missing out large price movements.
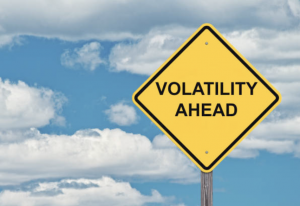
- In periods of high volatility, this indicator is prone to whipsaws, causing many signals to be triggered, generating potentially unprofitable signals as demonstrated below.
Conclusion
For the aforementioned reasons and our anecdotal research, the general consensus is that the Rate of Change indicator is better suited as a filter or confirmation signal than a primary one.
Hopefully, this insight inspires creative ways of utilizing this indicator, make sure to use Tuned’s batchtesting feature to fine-tune the best settings to your pair of choice!
Have fun scripting!
In this article, we’ll be talking about the Momentum indicator.We’ll be exploring what it does, its common uses and how it can be applied to …
Out of 50,000 trading bots there’s a strong chance at least one is profitable. In 2021 Tuned traders tested over 200 million bots, but we …
This article marks the beginning of a new series on our blog. We’ll dig into a trading strategy developed by QuickFingers Luc and apply it …
Volatility refers to the amount of price change over a given period of time. The greater the amount and velocity of change, the higher …


