
Disclaimer: The opinions expressed here are for general informational purposes only and are not intended to provide specific advice or recommendations for any specific security or investment product. You should never invest money that you cannot afford to lose. Before trading using complex financial products, please ensure to understand the risks involved. Past performance is no guarantee of future results.
Volatility refers to the amount of price change over a given period of time. The greater the amount and velocity of change, the higher the volatility is. This creates uncertainty for many investors, preventing participation. However, we welcome volatility and see each movement as an opportunity to profit.
The first thing to note is that trading volatility requires constant monitoring with multiple buy and sell orders. Manual traders may argue their methods have better adaptability and potential for greater results. However, with automated trading, there is an undeniable advantage that comes with 24/7 market awareness, instant reaction time, and reduced data entry errors.
Here are some indicators we can use to find volatility:
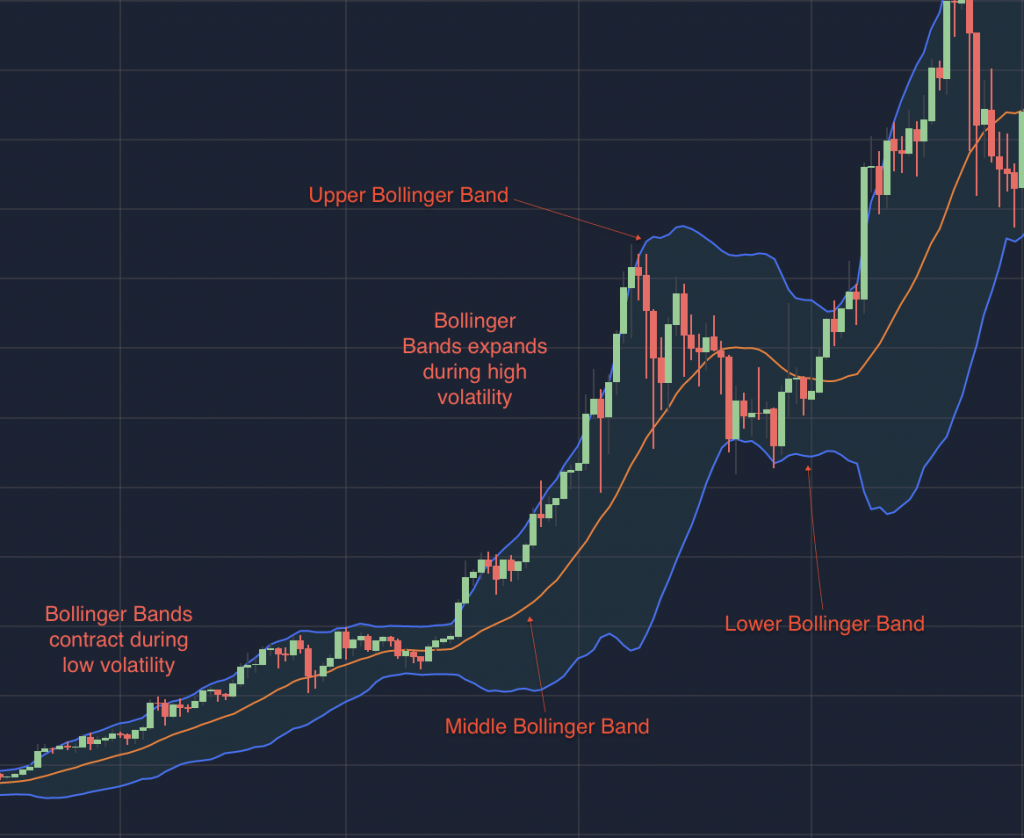
- Bollinger Bands consist of 3 bands: the upper, lower and middle bands. The middle band is the 20 days or bars moving average, the upper band is +2 Standard Deviation and the lower band is the -2 Standard Deviation of the middle band. Bollinger Bands expand during increased market volatility and contract when the volatility lowers.
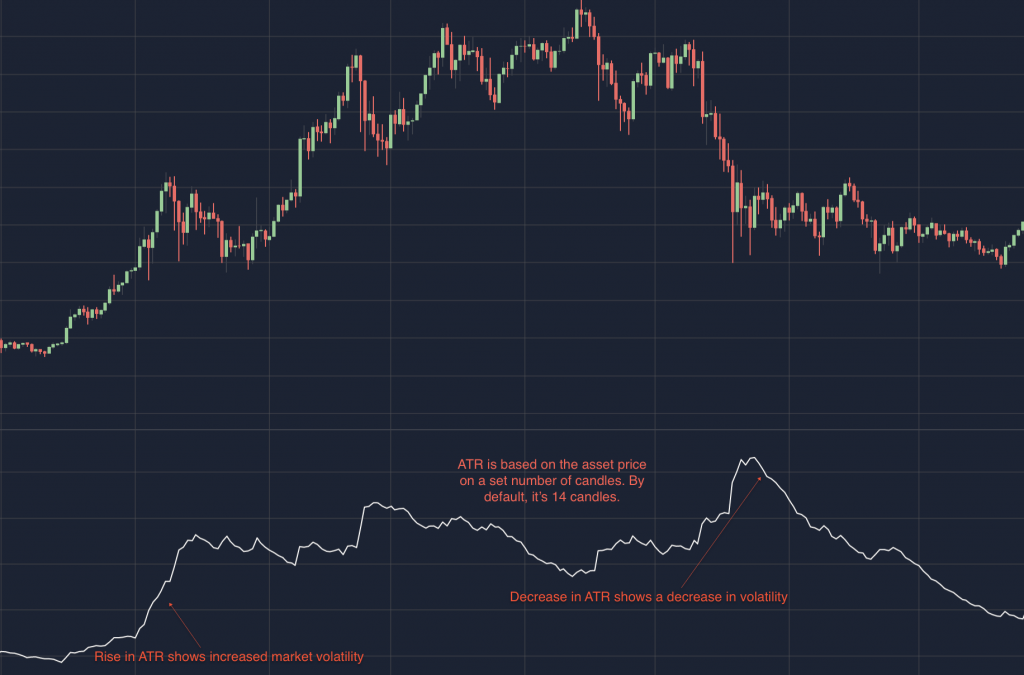
- Average True Range (ATR) measures an asset’s price range based on a set number of candles, usually 14. A rise in ATR indicates higher trading ranges and thus an increase in volatility. Whereas low readings from the ATR indicate periods of quiet or uneventful trading.
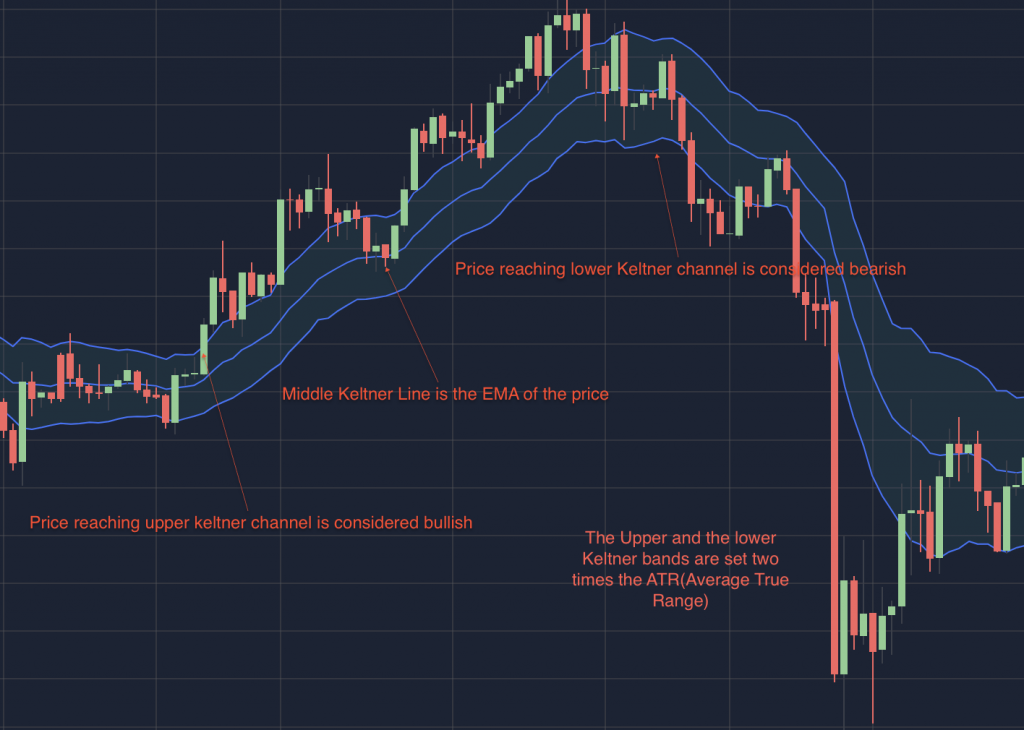
- Keltner Channel is a volatility-based indicator composed of three lines. The middle line is an EMA (Exponential Moving Average) of the price. The other two lines are placed above and below the EMA. The upper and the lower bands are set two times the average true range (ATR) above and below the EMA. Bullish sentiment is can be assumed when the price reaches the upper Keltner Channel band while trending towards the lower band is bearish.
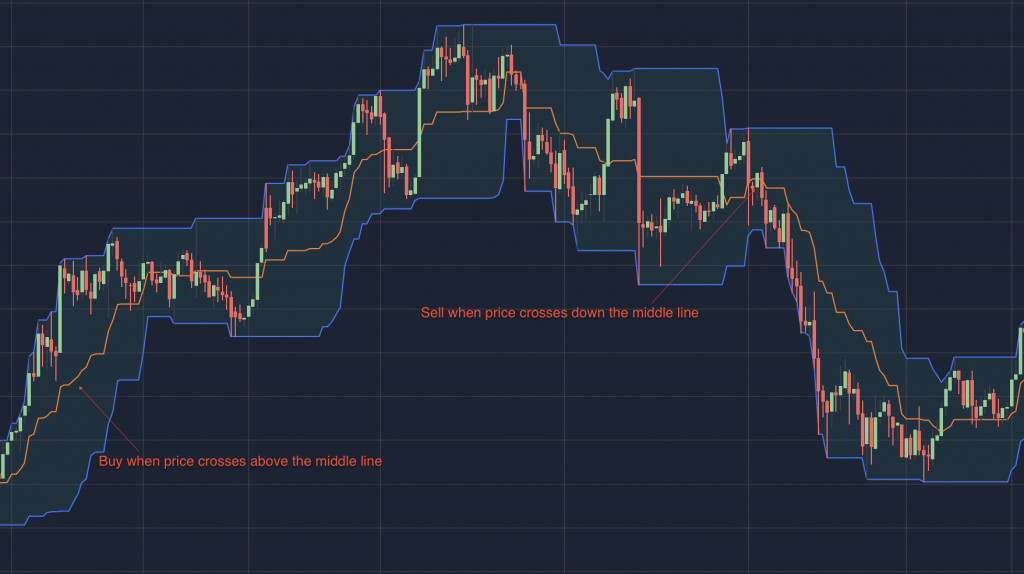
- Donchian Channel is an overlay price-based technical indicator set to track when support and resistance lines over the specified period are broken. In addition, the Donchian Channel could be also used to track the volatility of a security. One can consider buying when the price crosses over the middle line of the Donchian Channel and vice versa to sell.
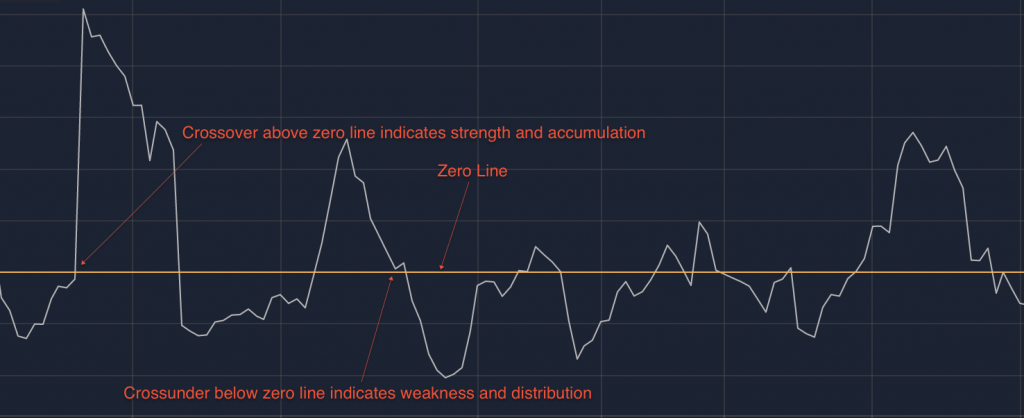
- Chaikin Volatility generates an oscillator that applies Moving Average Convergence Divergence (MACD) to accumulation-distribution rather than price. A crossover above a zero line indicates strength and accumulation while a crossunder below a zero line indicates weakness and distribution.
Now, that we’ve gone over different methods to find volatility, it’s time to make something. Whether or not you’re writing your first trading strategy, you’ll want to define a risk management system. Be practical here, this isn’t a casino. We want our traders to stick around for the long game and succeed.
After making something, the first thing you’ll want to know is if your strategy is effective. Tuned has you covered. Run thousands of concurrent backtests to vet your strategy across various assets and exchanges. Through experimentation we expect that strategy creators may unlock optimal parameters, carrying profits much further than default values.
Results are delivered quickly, so patience is not required.
But wait! Before throwing real assets at a new strategy, we recommend you run a paper trade in order to forward test your strategy. The goal here is to verify whether the strategy is really trading or if it’s simply ‘following the curve’. Matching a strategy too closely with available historical data poses a real risk and may result in bad performance.
If your strategy proves itself for 2 to 3 months, riding different market conditions, you could start putting real money in it or even list it on the Tuned Invest page for others to invest in.
Not familiar with the Tuned Invest page? Have a look at our navigation guide!
In this article, we’ll be exploring what the On-Balance Volume (OBV) indicator is, what it measures, common uses, and how it can be applied to …
In this article, we’ll be exploring what the Arnaud Legoux Moving Average (ALMA) indicator is, what it measures, common uses, and how it can be …
Table of Contents:
What is overfitting?How do I avoid overfitting?
For the investors reading this article, you can skip ahead to “What is Overfitting?”
By this point you …
And here we have it: the last installment of the data science article series! In our previous article, we created some correlated clusters and came …


