
Disclaimer: The opinions expressed here are for general informational purposes only and are not intended to provide specific advice or recommendations for any specific security or investment product. You should never invest money that you cannot afford to lose. Before trading using complex financial products, please ensure to understand the risks involved. Past performance is no guarantee of future results.
In this article, we’ll be talking about the Momentum indicator.
We’ll be exploring what it does, its common uses and how it can be applied to Tuned and algorithmic trading in general.
Table of contents
- What is the Momentum Indicator?
- How is Momentum calculated?
- Common uses
- An example strategy using Momentum on Tuned
- Conclusion
What is the Momentum Indicator?
The Momentum indicator is an oscillator that shows traders the direction of a trend. It measures the rate of change in price by comparing current and past values. It is a leading indicator that measures the rate at which an asset’s price changes and is generally used together with other indicators. The momentum indicator is shown as a line that oscillates up and down. Specifically, it’s an unbound oscillator.
How is Momentum calculated?
The calculation for Momentum is quite simple.
Momentum = Current Close – Close n periods ago
Common uses
When using Momentum, traders often combine the indicator with others to improve the success rate of the signals produced. We use momentum to define the direction of a trend and the strength it may have. On this note, we can define a trend with 4 major points;
- If momentum crosses above the 0 line the trend has turned bullish, meaning positive momentum.
- If momentum crosses below the 0 line the trend has turned bearish, meaning negative momentum.
- If momentum is rising in comparison to its previous values, this could indicate a reversal to the upside or that the market is already in an upwards trend.
- If momentum is falling in comparison to its previous values, this could indicate reversal to the downside or that the market is already in a downwards trend.
While Momentum on its own can be a strong indicator of market strength and trend direction, it would be advised to use this in unison with other indicators. Combining it with something else has high potential to improve the strategy. A commonly used example is to combine momentum with a Mean Reversion strategy. When adding momentum to the strategy you are essentially strengthening the signal by only entering a trade when you have confluence between the conditions of the strategy.
An example strategy using Momentum on Tuned

The code is as follows:
Tuned Script
// Inputs
len = intInput("Momentum Length", 10)
risFal = intInput("Momentum Rising/Falling Length", 3)

// Indicator Formula
mom = close - shift(close, len)

// Momentum Built-in
mom1 = mom(close, len)

// Plot
plot(mom, "Momentum", "#004BEC", 2, PlotStyle.LINE, 0, false)
plot(mom1, "Momentum Built-in", "#444B44", 2, PlotStyle.LINE, 0, false)

// Conditions
buy = and(crossover(mom, seriesOf(0.0)), rising(mom, risFal))
sell = and(crossunder(mom, seriesOf(0.0)), falling(mom, risFal))

// Signals
out(signalIf(buy, sell))
Pine Alpha
//@version=4
strategy(title="Momentum", overlay = false)

// Inputs
len = input(title = "Momentum Length", defval = 10)
risFal = input(title = "Momentum Rising/Falling Length", defval = 3)

// Indicator Formula
mom = close - close[len]

// Momentum Built-in
mom1 = mom(close, len)

// Plot
plot(mom, title = "Momentum", color = #004BEC)
plot(mom1, title = "Momentum Built-in", color = #444B44)

// Conditions
buy = crossover(mom, 0.0) and rising(mom, risFal)
sell = crossunder(mom, 0.0) and falling(mom, risFal)

// Signals
if buy
    strategy.order("Long", strategy.long)

if sell
    strategy.order("Short", strategy.short)
The strategy above will buy when the momentum indicator crosses above the 0 line, and when it has been rising for 3 consecutive candles. A sell signal is produced when the momentum indicator crosses below the 0 line, and price has been falling for 3 consecutive candles.
How does it behave?
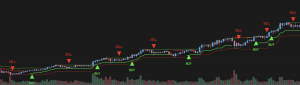
- The Momentum line will trend down when price drops. A stronger downtrend will plot a steeper decline.
- The Momentum line will trend up when price increases. A stronger uptrend will plot a steeper incline.
- In a ranging market the Momentum will often fluctuate around 0.
- In periods of high market volatility you can expect Momentum to also be choppy.
Adding risk management rules, like stop loss and take profit, can also help improve profitability.
Conclusion
Momentum in isolation can tell a story of multiple market factors like trend strength, trend direction, market volatility, or if a trend is coming to an end. However, it doesn’t do very well on its own. The momentum indicator helps traders identify potential reversals, but keep in mind it will also produce a lot of noise. With that being said, I hope this has helped your understanding of its function, the conditions of the strategy and how to make it even better!
Have fun scripting!
If you’re looking for massive profits in the market, you will have to build a capable strategy. Crypto markets are inherently volatile, which is both …
In this article, we’ll be exploring what the Arnaud Legoux Moving Average (ALMA) indicator is, what it measures, common uses, and how it can be …
Despite automated trading, markets are still largely driven by human participation. Those who pay close attention to the markets will see opportunities for profit using …
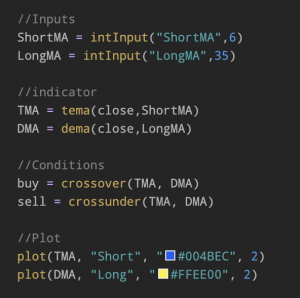
Table of contents:
An alternative to Pine ScriptData FlowWhy two different languages?Example of Pine Script (RSI)Example of Tuned Script (RSI)Executing OrdersPlotting – visualize a strategy
An alternative …


