


Disclaimer: The opinions expressed here are for general informational purposes only and are not intended to provide specific advice or recommendations for any specific security or investment product. You should never invest money that you cannot afford to lose. Before trading using complex financial products, please ensure to understand the risks involved. Past performance is no guarantee of future results.
In this article, we’ll be exploring what the Arnaud Legoux Moving Average (ALMA) indicator is, what it measures, common uses, and how it can be applied to Tuned and algorithmic trading in general.
Table of contents
- What is the ALMA indicator?
- How is the ALMA calculated?
- Common uses
- An example strategy using ALMA in Tuned
- Conclusion
What is the ALMA indicator?
As the name suggests, the ALMA indicator is a moving average (MA) variant and was created by Arnaud Legoux in 2009. The goal was to decrease the lag commonly encountered with moving averages.
As with most moving averages, this indicator aims to detect trends and trend reversals. It works similarly to other moving averages, but one of the main differentiators is that it calculates 2 moving averages, one from left to right and one from right to left. This output is then further processed through a customizable formula, for either increased smoothness or increased responsiveness.
Because of its similarity to a moving average, you’ll notice the applications are also similar.
- Applying 2 ALMAs with different lengths can provide signals when they cross;
- Crosses between the price and an ALMA can provide signals;
- Combining any of the above with conditions derived from other indicators.
How is the ALMA calculated?
To explain the formula there are 3 variables to consider:
Window: Also referred to as size or lookback, it represents the amount of price data we will use. The default value is 9, which means we will look at the previous 9 candles.
Offset: A multiplier that determines the indicator’s alignment to price. The default value is 0.85 but can range in decimals from 1 to 0. An offset of 1 will make the indicator follow the price exactly while something closer to 0 introduces more lag.
Sigma: Not to be confused with the Greek letter for summation, this represents the filter’s range. The default value is 6, and lower values will make the ALMA indicator less reactive to price changes.
The formula for calculating the ALMA is the following:
We use our input series (source/price data), weights determined by our offset, and width determined by sigma. Together these form a weighted sum based on our window (size/lookback), and the process repeats for the next candle.
Common uses
The ALMA was created with the goal of reducing the price lag usually associated with moving averages. As with most MAs, the Arnaud Legoux Moving Average is used to follow trends and detect trend reversals in price. In short, the ALMA helps you:
- Identify trends;
- Identify reversals in trends;
- Find confluence with other technical indicators.
An example strategy using ALMA in Tuned
The code is as follows:
Tuned Script
<sup>//Inputs
Length = intInput("Length Fast ALMA",13)
Offset = numInput("Offset Fast ALMA",0.01)
Sigma = numInput("Sigma Fast ALMA",4.5)
Length2 = intInput("Length Medium ALMA",11)
Offset2 = numInput("Offset Medium ALMA",0.01)
Sigma2 = numInput("Sigma Medium ALMA",1.5)
Length3 = intInput("Length Slow ALMA",66)
Offset3 = numInput("Offset Slow ALMA",0.01)
Sigma3 = numInput("Sigma Slow ALMA",3.5)

//indicator
FastALMA = alma(close, Length, Offset, Sigma)
MediumALMA = alma(close, Length2, Offset2, Sigma2)
SlowALMA = alma(close, Length3, Offset3, Sigma3)

//Conditions
buy = and(crossover(FastALMA, MediumALMA), gt(SlowALMA, MediumALMA))
sell = and(crossunder(FastALMA, MediumALMA), lt(SlowALMA, MediumALMA))
clsBuy = and(position_long, crossover(MediumALMA, FastALMA))
clsSell = and(position_short, crossunder(MediumALMA, FastALMA))

//Plot
plot(FastALMA, "Short", "#11D12B", 2)
plot(MediumALMA, "Short", "#BB11D1", 2)
plot(SlowALMA, "Short", "#1114D1", 2)
//Signal Push
out(signalIf(buy, sell, clsBuy, clsSell))</sup>
Click here to add this script to your account.
Pine Alpha
<sup>//@version=4
//Tuned supports Pine Version 4 Only
strategy(title="Arnaud Legoux Moving Average", overlay = true)

//Inputs
Length = input(title = "Length Fast ALMA", defval = 13)
Offset = input(title = "Offset Fast ALMA", defval = 0.01)
Sigma = input(title = "Sigma Fast ALMA", defval = 4.5)
Length1 = input(title = "Length Medium ALMA", defval = 11)
Offset1 = input(title = "Offset Medium ALMA", defval = 0.01)
Sigma1 = input(title = "Sigma Medium ALMA", defval = 1.5)
Length2 = input(title = "Length Slow ALMA", defval = 66)
Offset2 = input(title = "Offset Slow ALMA", defval = 0.01)
Sigma2 = input(title = "Sigma Slow ALMA", defval = 3.5)

//indicator
FastALMA = alma(close, Length, Offset, Sigma)
MediumALMA  = alma(close, Length1, Offset1, Sigma1)
SlowALMA = alma(close, Length2, Offset2, Sigma2)

//Conditions
buy = crossover(FastALMA, MediumALMA) and SlowALMA > MediumALMA
sell = crossunder(FastALMA, MediumALMA) and SlowALMA < MediumALMA
clsBuy = strategy.long and crossover(MediumALMA, FastALMA)
clsSell = strategy.short and crossunder(MediumALMA, FastALMA)

//Plot
plot(FastALMA, title = "Short", #11D12B, 2)
plot(MediumALMA, title = "Long", #BB11D1, 2)
plot(SlowALMA, title = "Long", #1114D1, 2)

//Signal Push
strategy.order("long", strategy.long, when = buy)
strategy.order("short", strategy.short, when = sell)
strategy.close("long", strategy.long, when = clsBuy)
strategy.close("short", strategy.short, when = clsSell)</sup>
Click here to add this script to your account.
For demonstration purposes, a strategy was coded with the following parameters:
- 3 ALMAs
- Fast ALMA (Length – 13; Offset – 0.01; Sigma – 4.5)
- Medium ALMA (Length – 11; Offset – 0.01; Sigma – 1.5)
- Slow ALMA (Length – 66; Offset – 0.01; Sigma – 3.5)
- Stop Loss = 7%
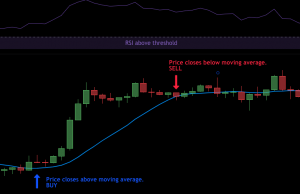
Strategy conditions:
- Long when Fast ALMA crosses over Medium ALMA
- Short when Fast ALMA crosses under Medium ALMA
- Slow ALMA must be above Medium ALMA to long
- Slow ALMA must be below Medium ALMA to short
- Close Long when Medium ALMA crosses over Fast ALMA
- Close Short when Medium ALMA crosses under Fast ALMA
Using the crosses of 2 MAs to generate signals is not a new concept in trading. The challenge is filtering excessive signals during indecisive markets. One method is a combination of 3 ALMAs with different lengths that can provide better performance by comparing short, medium and long timeframe trends found in different time periods. The 3rd ALMA allows signals to be filtered relative to it, like a 200 period moving average. In our example, it provides an insight into the longer trend. This allows us to confirm uptrends and reversals with higher confidence by finding confluence in multiple timeframes.
How does it behave?
- In sideways markets, this strategy is prone to whipsaws, triggering too many signals. A volatility filter is a good option to help in these scenarios.
- In trending markets, this strategy can produce profitable trades by following the trend. We found timeframes equal to or higher than 30min to produce better results.
Conclusion
One of the main advantages of the Arnaud Legoux Moving Average, when compared to other Moving Averages, is the degree of customization it provides, this is especially relevant in algorithmic trading and allows us to leverage Tuned’s batch testing functionality to test thousands, even millions of settings and see how they perform on historical data. As with most trend following strategies, drawdowns must be considered during its inception. Time between equity peaks might be extended if no clear trends are set. We recommend forward testing to verify the performance achieved on historical data.
The script and settings provided above should only be used for educational purposes, we highly recommend experimenting with multiple indicators and improving upon the example provided above.
Have fun scripting!
Have you ever seen a chart and wished you could trade all its ups and downs? The profit potential may be tempting but watching candles …
In today’s price action post, we will cover time frames, the importance of confluence between time frames, and candle patterns (covered in chapter 5). There …
We’ll be talking about the Williams %R indicator in this article.
We will look at what it does, how it’s used, and how it can be …
Out of 50,000 trading bots there’s a strong chance at least one is profitable. In 2021 Tuned traders tested over 200 million bots, but we …


