
Disclaimer: The opinions expressed here are for general informational purposes only and are not intended to provide specific advice or recommendations for any specific security or investment product. You should never invest money that you cannot afford to lose. Before trading using complex financial products, please ensure to understand the risks involved. Past performance is no guarantee of future results.
Welcome back, data science fans!
Continuing from the second article, where I discussed the clustering of buy signals, we’re now ready to get into the meat of things: finding correlated groups. The idea is to find two or more strategies that when combined, give much stronger performance than each would achieve alone. We’ll start with combining just two strategies together and deciding metrics to measure their performance, before moving to larger correlated groups. Let’s jump right in!
Finding Correlated Pairs
In our last article, we concluded that simply pairing random strategies and taking their correlated buy signals would not yield the results we wanted. Instead, we must combine strategies systematically. Here’s the process we used to find correlated pairs:
- Find all possible pairs of strategies
- For each pair, go through every cluster and find correlated buy signals (if they exist)
- Calculate performance metrics for each pair from correlated buy signals
We know how to do steps 1 and 2. However, what are the performance metrics we’ll use for step 3?
Our 5 Performance Metrics
These metrics will allow us to compare our strategy pairs with the individual strategies they came from, and compare correlated pairs with one another. Here’s what they are:
| Performance Metric | Description | Why it’s useful |
| Profit Factor* | Gross Profit ÷ Gross Losses | Are we winning more or losing less? |
| Average Net Profit* | Average profit across all trades | On average, are we winning more for each trade? |
| Profitable Trades | Percentage of total trades that are profitable (see our last article) | Is the proportion of winning trades increasing? |
| Average Profitable Trade* | Average profit across all profitable trades | Are our winning trades earning more? |
| Average Unprofitable Trade* | Average profit across all unprofitable trades | Are our losing trades losing less? |
There’s a couple of notes to make. First, some readers might find it strange that I haven’t included some of the other conventional metrics, like Maximum Drawdown (MDD). Given the method I’m using to combine strategies, calculating MDD would be quite difficult and so I decided to exclude it from the list. However, be mindful that the results presented will not include this measurement of risk. Second, the metrics denoted by * are not calculated conventionally. Rather than using the actual profit in currency, we use the compounded percentage profits. Thus, these metrics are measured with percentages.
We calculate percentage profit with the following formula:
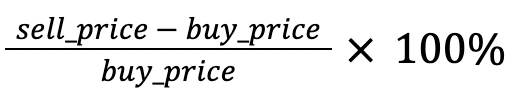
For the buy price, we must always take the last buy signal that occurs, since we’ll only know it’s a correlated buy signal if both fire. However, with sell signals, we can be pickier.
Choosing a Sell Signal
We have 4 options:
- First: we take the price of the first sell signal that fires from either of the two strategies
- Average: we average the prices of both sell signals, effectively selling half of our exposure at every sell signal
- Strategy 1: We denote one of the strategies as strategy 1 and take only the prices of the sell signals of that strategy, ignoring the other strategy.
- Strategy 2: Same as Strategy 1 but for the other strategy.
So, when looking at the metrics from strategy groups, we must look at all 4 options of sell signals and can see which sell signal performs the best.
Results
Here’s the exciting part!
After performing all 3 steps, calculating the 5 performance metrics for all 4 options, we can see which strategy pairs perform the best. Here are our best performing correlated pairs:
Note: to protect the privacy of our creators and their strategies, the individual strategies that make up the correlation pairs are kept unidentified.
Correlated Pair 1:
| Strategy | Profit Factor | Average Net Profit | Profitable Trades | Average Profitable Trade | Average Unprofitable Trade |
| Correlated Pair (First) | 6.68 | +1.06% | 68.33% | +1.83% | -0.59% |
| Strategy 1 | 1.01 | +0.01% | 49.16% | +2.01% | -1.93% |
| Strategy 2 | 1.09 | +0.07% | 51.65% | +1.69% | -1.65% |
For these two strategies, the first sell gave the best performance across all four options of choosing sell signals. As we can see, the profit factor and average net profit are significantly higher in the correlated pair than in the individual strategies. This can be attributed to its higher percentage profit, giving it a higher percentage of winning trades. Furthermore, while its average profitable trade isn’t the highest, it has a comparably low average unprofitable trade, so it loses less for each loss-inducing trade (-0.59% as opposed to -1.93% and -1.65% for the individual strategies).
Let’s take a look at another one…
Correlated Pair 2:
| Strategy | Profit Factor | Average Net Profit | Profitable Trades | Average Profitable Trade | Average Unprofitable Trade |
| Correlated Pair (Strategy 2) | 2.60 | +1.69% | 63.01% | +4.36% | -2.85% |
| Strategy 1 | 1.15 | +0.25% | 53.50% | +3.60% | -3.61% |
| Strategy 2 | 1.30 | +0.33% | 51.42% | +2.78% | -2.25% |
This correlated pair takes sell signals only from the second strategy. Again, we see significant improvements in profit factor and average net profit, although not as drastic as in our previous correlated pair. Again, we can attribute this to the correlated pair’s higher % profit. However, we also see a significant increase in the average profitable trade, telling us that each winning trade is netting us more on average, a mean of +4.36% per profitable trade.
These are already pretty incredible numbers, but what if we kick it up a notch?
Larger Correlated Groups
So far, we’ve been dealing with correlated groups with two strategies. Now, let’s increase the number of strategies in a group. The process of finding signals is the same, but instead of taking every pair like in step 1, we take every triple or quadruple.
However, note that as the number of strategies in a group increases, it becomes harder to find clusters where all strategies fire buy signals. To illustrate the point, correlated groups with 2 strategies have on average 115 trades, as compared to 71 and 50 trades for correlated groups with 3 and 4 strategies respectively. This leaves us prone to overfitting on limited data as we increase the number of strategies in a group.
So, we only consider strategy groups that trade at least once every 3 days. Furthermore, we only look at strategy groups up to a size of 4, as going further than that will produce unhelpful conclusions. Let’s take a look!
Correlated Triple 1:
| Strategy | Profit Factor | Average Net Profit | Profitable Trades | Average Profitable Trade | Average Unprofitable Trade |
| Correlated Triple (First) | 7.58 | +1.10% | 69.49% | +1.83% | -0.55% |
| Strategy 1 | 1.01 | +0.01% | 49.16% | +2.01% | -1.93% |
| Strategy 2 | 1.09 | +0.07% | 51.65% | +1.69% | -1.65% |
| Strategy 3 | 0.97 | -0.02% | 51.31% | +1.74% | -1.88% |
If you’ve noticed, this correlated triple has the same strategies as our first correlated pair, but includes an additional strategy. We see improvements across profit factor and average net profit, mostly due to the higher percentage profit. However, it’s a lackluster improvement over the correlated pair, which was a strong performer already.
Correlated Triple 2:
| Strategy | Profit Factor | Average Net Profit | Profitable Trades | Average Profitable Trade | Average Unprofitable Trade |
| Correlated Triple (Strategy 1) | 2.66 | +1.77% | 65.65% | +4.31% | -3.09% |
| Strategy 1 | 1.30 | +0.56% | 55.56% | +4.35% | -4.18% |
| Strategy 2 | 1.14 | +0.23% | 48.09% | +4.01% | -3.27% |
| Strategy 3 | 1.90 | -1.22% | 58.78% | +4.37% | -3.29% |
Again, we see improvements across profit factor and average net profit, largely thanks to a higher percentage profit and lower average unprofitable trade.
As we’ve seen, performance improves slightly as we increase from pairs to triples. However, performance actually decreases as we move from triples to quadruples. For example, the best performing correlated group with 4 strategies has a profit factor of 7.55 and a average net profit of +1.10%, a slight decrease from Correlated Triple 1. So, it seems that triples are the sweet spot here, although pairs perform fantastic as well.
Recap
Today, we went over the process of finding correlated groups and saw them in action, with some pretty phenomenal results! In the next and final article, we’ll wrap it all up, discussing next steps, potential ideas, and how you can apply these findings to your strategies. Until then, happy trading!
In our last blog post, I introduced my project to combine buy signals from different strategies to potentially generate higher returns for all traders on …
And here we have it: the last installment of the data science article series! In our previous article, we created some correlated clusters and came …
Picture this: the new iPhone 17 Ultra Pro Max just dropped, and you’re debating whether or not to switch up your mobile device. The new …


