
Disclaimer: The opinions expressed here are for general informational purposes only and are not intended to provide specific advice or recommendations for any specific security or investment product. You should never invest money that you cannot afford to lose. Before trading using complex financial products, please ensure to understand the risks involved. Past performance is no guarantee of future results.
Despite automated trading, markets are still largely driven by human participation. Those who pay close attention to the markets will see opportunities for profit using these classical trading patterns. These aren’t written in stone, but should grant a great deal of confidence in predicting the market’s next direction.
What’s more, market movements are fractal in nature, meaning these patterns can be discovered on any time frame – monthly, weekly, daily, intra-day, etc. You will see that these chart patterns also tend to repeat themselves.
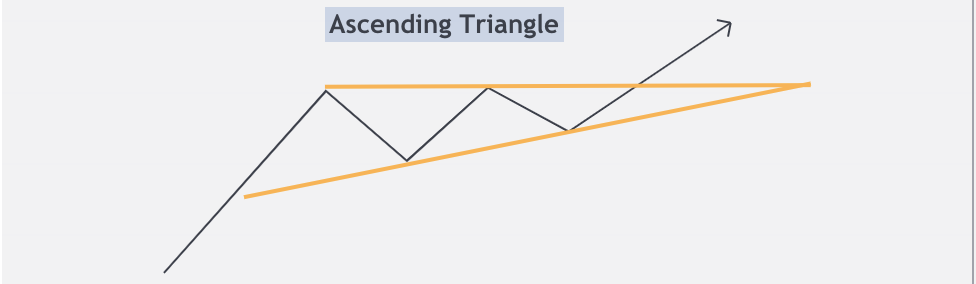
Ascending Triangle is a bullish continuation pattern. It is also called a ‘rising triangle’. It is formed by a rising lower trend line and a flat upper trend line that acts as resistance. This pattern indicates that the buyers are more aggressive than the sellers as the price continues to make higher lows. This pattern completes itself when price breaks out of the triangle in the direction of the overall trend.
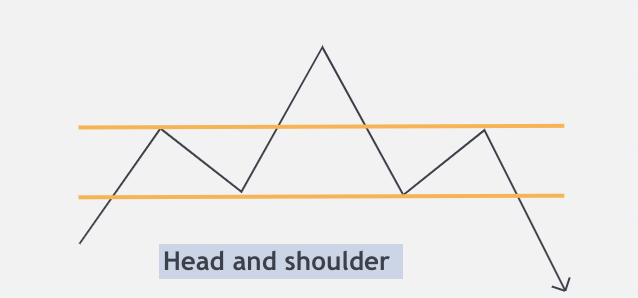
Head & Shoulder formation consists of a left shoulder, a head, and a right shoulder and a line drawn as the neckline. Volume is highest and often expands on the left shoulder as the uptrend continues and more and more investors want to get in, whereas it is lowest on the right shoulder as investors sense a trend reversal. This low volume is often considered a strong sign of reversal.
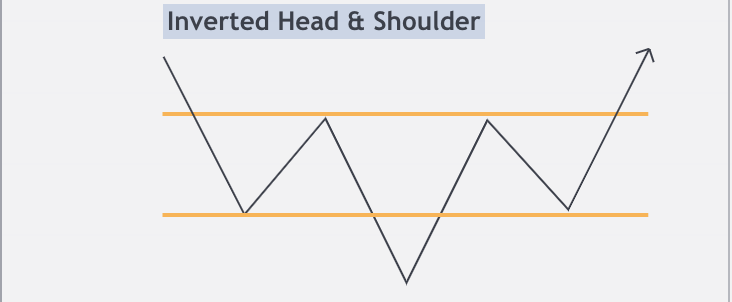
Inverse Head & Shoulder is a trend reversal pattern, from bearish to bullish. This pattern can be identified by its three peaks, the two outside peaks should be about the same height, and the middle one is the lowest.
This pattern is comprised of three parts: After long bearish trends, the price falls to a trough and then rises to make a peak. Again, the price falls to form a second trough below the previous low and increases again. The price falls for the third time, but only to the level of the first trough, before rising once more and reversing the trend.
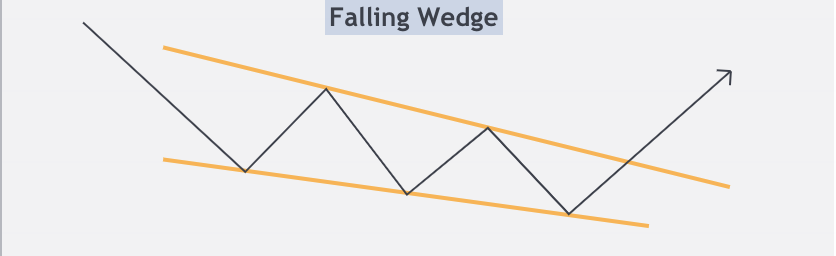
A Falling Wedge is created when a market consolidates between two converging support and resistance lines. A falling wedge is considered a bullish pattern. This price action forms a cone that slopes down as the highs and lows converge. This pattern is widest at the top and becomes narrower as it moves downward. It leads to tighter price action. If the falling wedge shows up in a downtrend, it is seen as a reversal pattern.
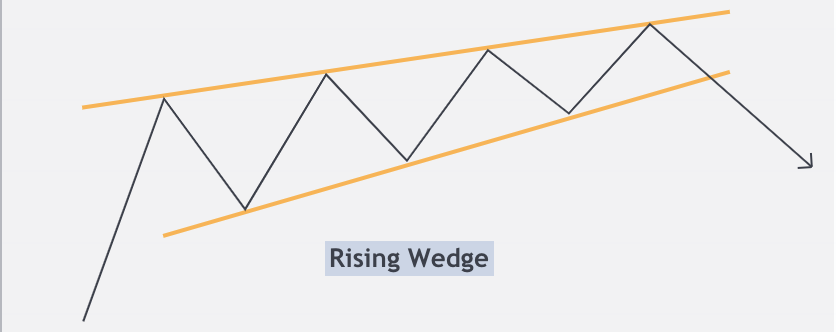
A Rising Wedge is a bearish pattern formed when the market begins making higher highs and higher lows. All of the highs must be in-line so that they can be connected by a trend line. This chart pattern has a wide trading range at the bottom and contracts to a smaller trading range as prices trend up. The rising wedge pattern signals a possible selling opportunity either after an uptrend or during an existing downtrend. The entry (sell order) is placed either when the price breaks below the bottom side of the wedge or the price finds resistance at the lower trend line.
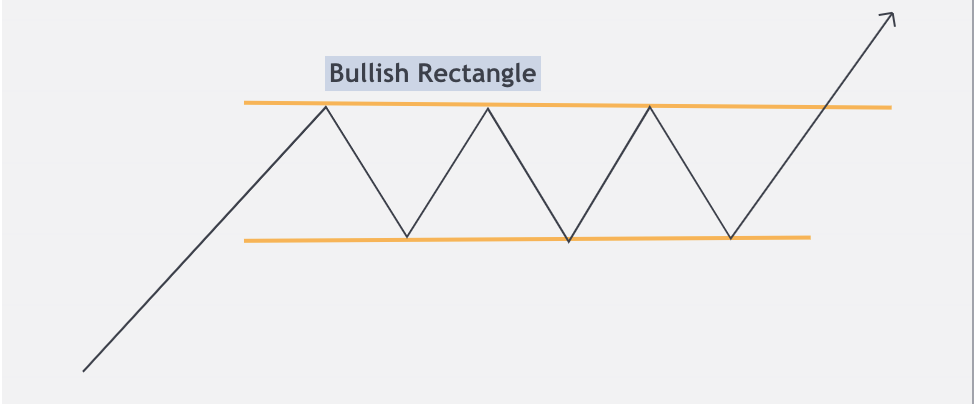
A Bullish Rectangle pattern is formed during an uptrend, defining the horizontal levels of support and resistance. The price keeps moving between the support and resistance lines. It maintains its highs and lows forming a trading range making a kind of a rectangle. These support and resistance lines should be parallel to each other. It is always advised to wait for a breakout confirmation on the resistance level to take a trade setup.
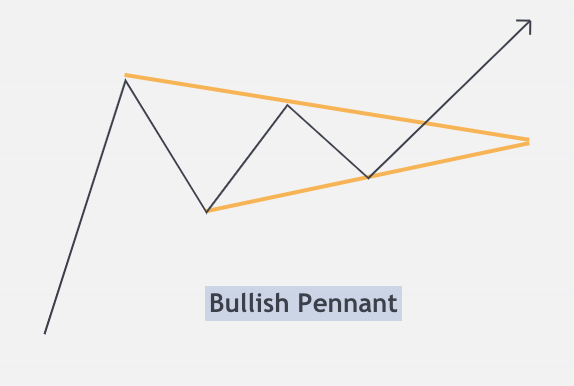
Bullish Pennant occurs just after a sharp rise in price and resembles a triangular flag as the price moves sideways, making gradually lower highs and higher lows. The uptrend then continues with another similar-sized rise in price. A bullish pennant has a pole that is created when the price experiences a sharp rise and then a pennant attached to the pole. The price when breaks the flag, signals a continuation of an uptrend.
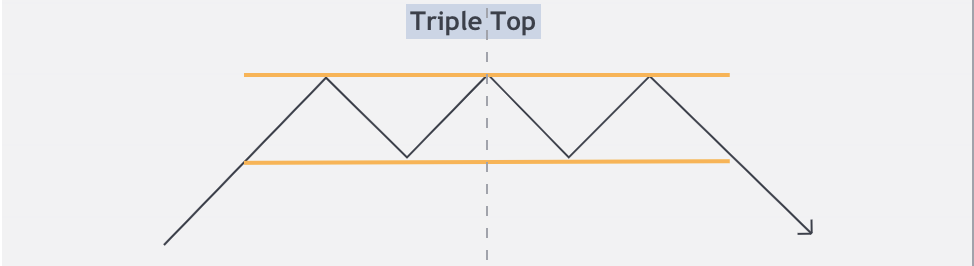
Triple Top is a bearish pattern. It is formed when the price makes three similar highs and then rejects to make a downtrend. The formation of this pattern is completed when the prices move back to the support line after forming the third peak.
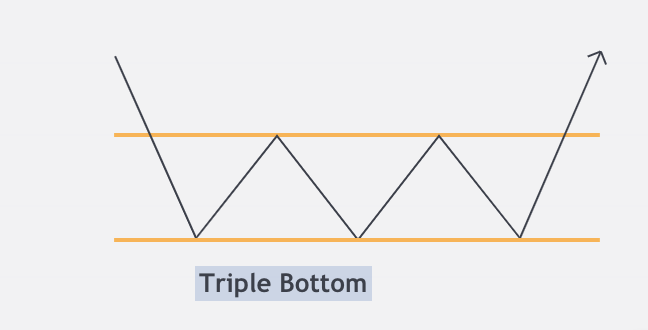
Triple Bottom signals a bullish reversal pattern. This pattern consists of three equal lows followed by a breakout above resistance. The three bottoms should be nearly equal in size and have sufficient space between them. The confirmation for this pattern is a close above the upper trend line with above-average volume. Traders should treat the triple bottom pattern as a neutral pattern until the breakout is confirmed. Once the upper resistance level is broken with a sharp increase in volume , the momentum will likely carry the price action higher.
Have you ever seen a chart and wished you could trade all its ups and downs? The profit potential may be tempting but watching candles …
Guacamole Bot – Our free DCA Bot! In this article we will explain how our free Dollar Cost Averaging script “Guacamole Bot” can be set …
In this article, we’ll be exploring what the Arnaud Legoux Moving Average (ALMA) indicator is, what it measures, common uses, and how it can be …
In this chapter of the price action series, we will cover the different market conditions of an asset. We will also cover how to approach …


