
Disclaimer: The opinions expressed here are for general informational purposes only and are not intended to provide specific advice or recommendations for any specific security or investment product. You should never invest money that you cannot afford to lose. Before trading using complex financial products, please ensure to understand the risks involved. Past performance is no guarantee of future results.
In our last blog post, I introduced my project to combine buy signals from different strategies to potentially generate higher returns for all traders on Tuned. Today, we’ll be diving deep into the process I took to cluster those buy signals together and exploring some initial findings. Let’s jump right in!
In case you missed our previous post…
Over the past summer, I’ve investigated the following question: if executing a buy order only when two or more strategies indicate a good time to buy, can we deliver higher profits than that of each individual strategy? Our first step is figuring out how to group buy signals from different strategies occurring around the same time, which I’ll refer to as clustering.
Now you may be asking…
What about clustering sell signals?
Good question! In the context of Tuned strategies, a buy signal initiates a trade position, and a sell signal closes it. For one, it’s more worthwhile to focus on clustering buy signals since it doesn’t require an open position. To cluster sell signals, positions from two or more strategies would have to be open first, which limits the number of signal combinations we can make.
Furthermore, it makes more sense logistically to focus on buy signals. When multiple buy signals from a set of strategies happen around the same time, we execute a buy order. From there, we either take the earliest sell signal of those strategies or the sell signal of the strategy with the best sell signals. This reasoning doesn’t work the other way around: it’s possible we could create an open position, but not have a cluster of sell signals to close it.
As a result, I decided to focus solely on clustering buy signals first, and then use those buy signals to figure out what the optimal sell signals are. But before we dive into that…
A Background on Tuned Strategies
Trading strategies on Tuned run on candles (also known as candlesticks). Here’s a candle:
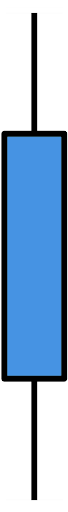
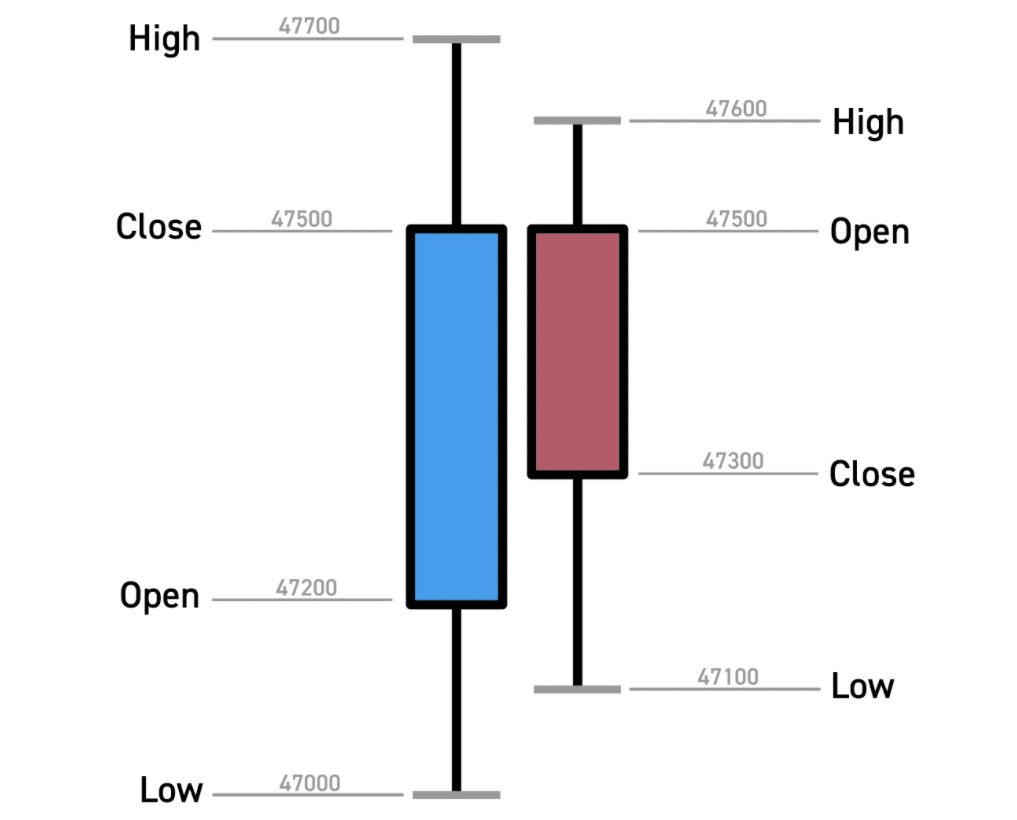
A candle represents the price movements of an asset over a specified length of time — e.g., 30 minutes, 1 hour, or even 1 day. In our case, this is a pair of cryptocurrencies. Each candle represents four values, OPEN, CLOSE, HIGH, LOW, and the price movement direction. Whether the open price was higher or lower than the closing price is indicated using the color of the candle. Traditionally, the color is green when CLOSE price > OPEN price and red when OPEN price > CLOSE price. Here’s the same candle again:
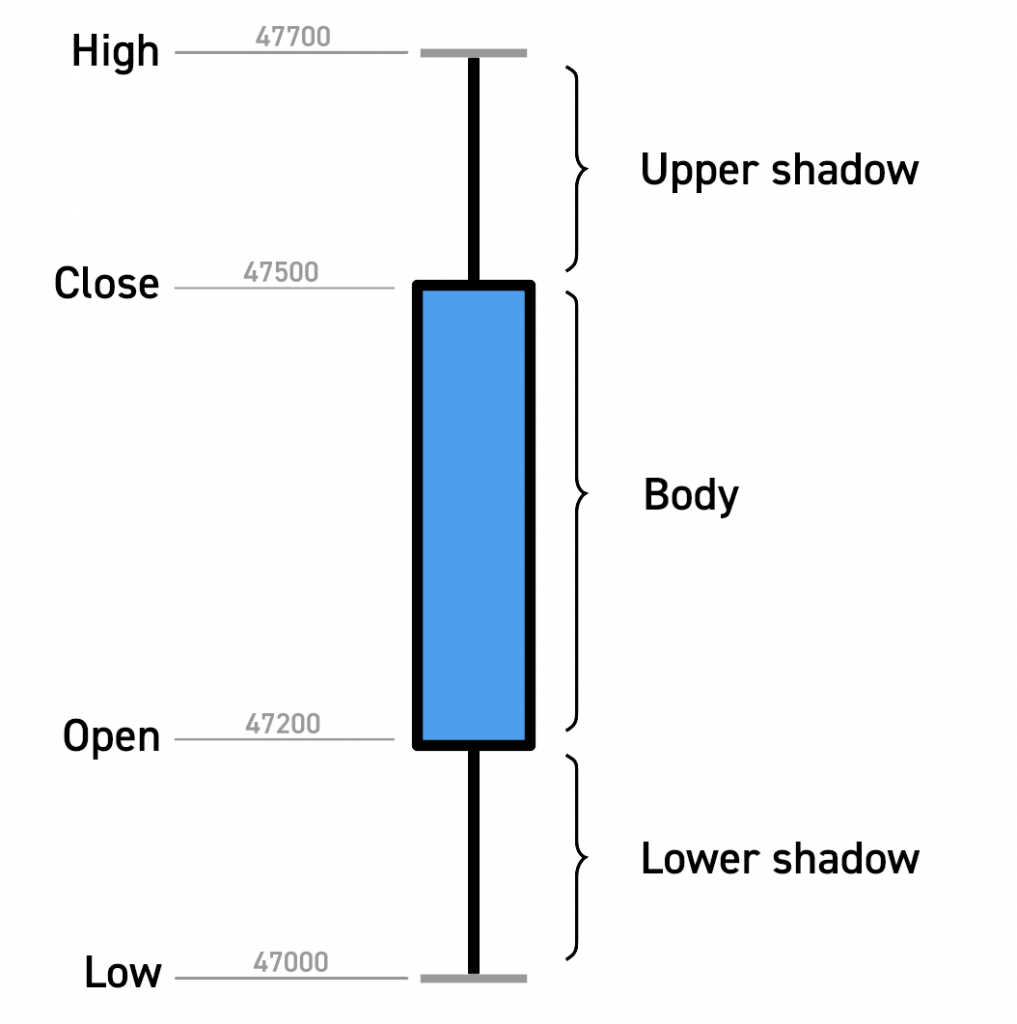
On our platform, a blue candle means the CLOSE price was higher than the OPEN price, and a red candle denotes the opposite.
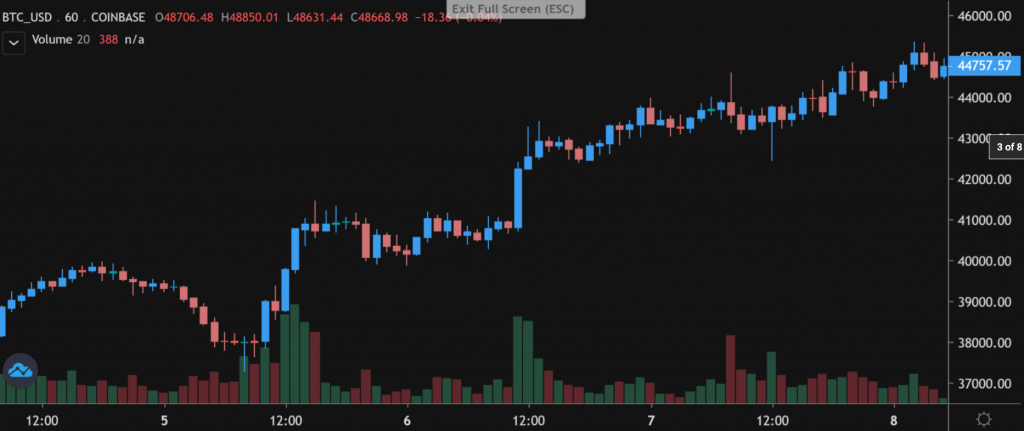
By using candles, we can show the price movements of an asset in a simplified manner:
Why do candles matter? It’s because all Tuned strategies trade on candles, and it’s how we’ll combine their signals!
Clustering Buy Signals — A Three-Step Process
Here’s what the signals of a Tuned strategy look like:
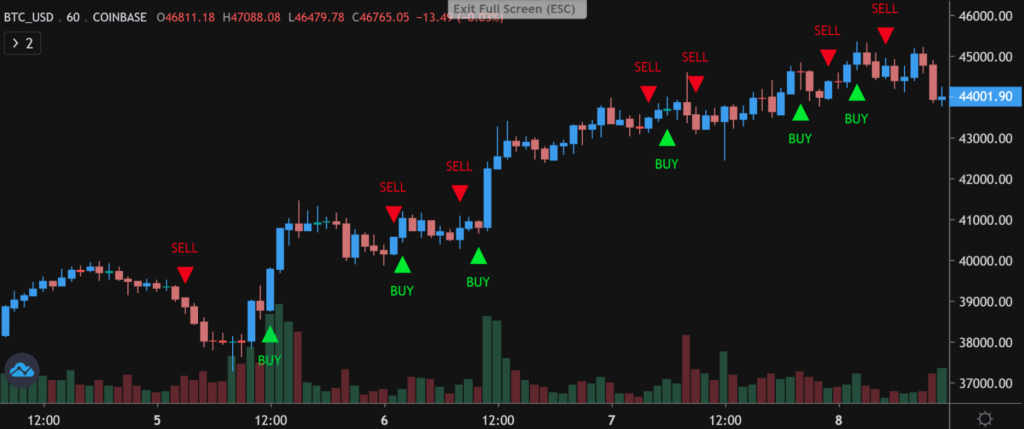
Disregarding stop loss and take profit, strategies generate signals only at the start or end of their candles. As such, the duration of a strategy’s candles indicates how frequently it can buy or sell. For example, a strategy with 15-minute candles can trade on a minimum of 15-minute intervals.
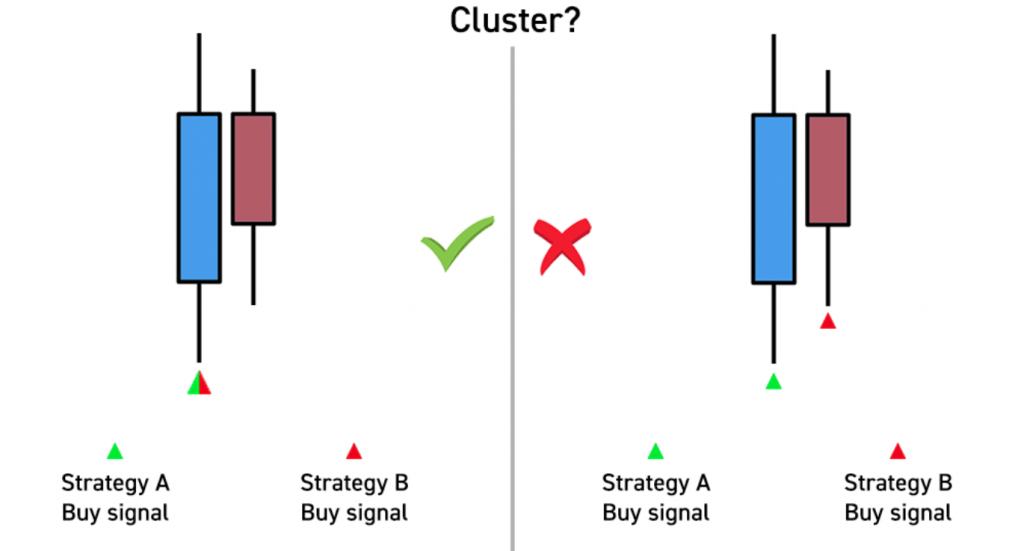
To approach the problem of clustering buy signals, I’m going to pick a candle size to allow us to define what a cluster represents. As an example, let’s choose 30-minute candles. Now, if two or more strategies generated a buy signal on the same 30-minute candle, we’ll say those signals are in the same cluster. On the other hand, if two signals occur on different 30-minute candles, even if they’re placed less than 30 minutes apart, they will not be a part of the same cluster:
With that established, there’s a clear path ahead: I’ll start by picking the candle size to define our clusters, and then code an algorithm to cluster our buy signals. Finally, I’ll end off with some preliminary results!
Step 1: Select Candle Size
Here’s a histogram of the candle sizes of different live strategies trading on BTC:
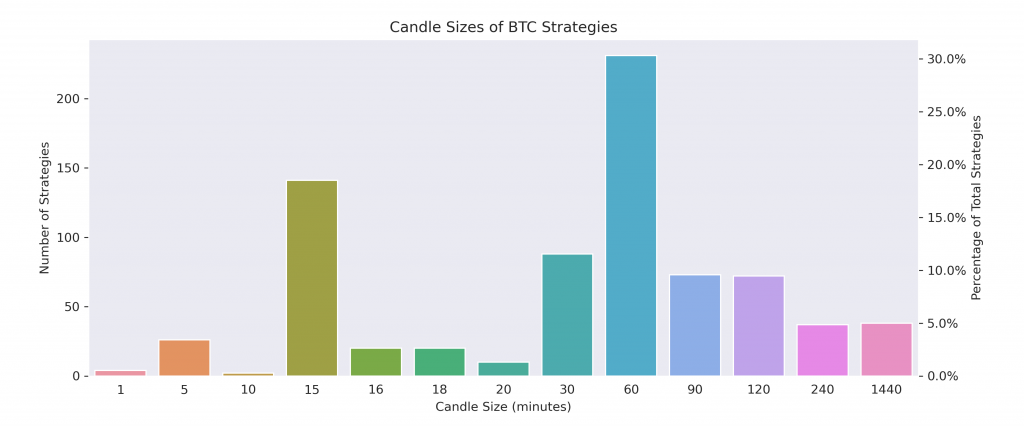
Out of the 762 BTC strategies trading on Tuned at the time of writing, 30% use 60-minute candles and ~20% use 15-minute candles. Strategies with 30, 90, and 120-minute candles represent around 10% each.
I decided to go with 60-minute candles to strike a good balance between smaller and larger candles and likely capture most clusters (we’ll increase the candle size if we’re unable to find many clusters down the line).
Step 2: Formulate Clustering Strategy
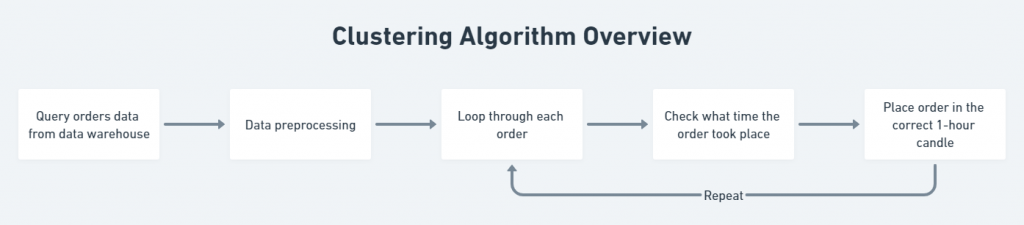
Next up, I coded an algorithm to cluster buy signals. On a high level, I first queried all the buy signals of strategies trading on BTC from the orders data in our data warehouse. From there, I iterated through all the signals and placed them in the correct 60-minute cluster — i.e., if a signal fired at 2:32 PM on August 20, it would be placed in the 2-3 PM cluster on that date (Tuned candles begin at midnight UTC every day). We also implemented a 1 minute buffer between candles to allow tolerance for signals fired after the CLOSE or before the OPEN of a candle, i.e., a signal fired at 3:00:25 AM joins both the 3 AM and 4 AM hourly clusters.
Step 3: Cluster Results
After running the clustering algorithm on 80,000 or so buy orders from BTC strategies, I began analyzing the results by visualizing the frequency of different cluster sizes. My goal was to confirm if we had enough buy signals falling into clusters to determine whether the 60-minute candle size was large enough.
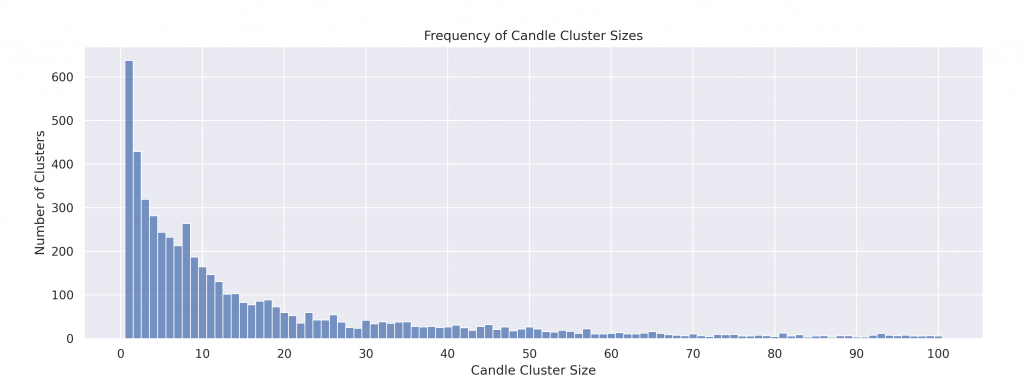
Great news! Since there are only a little over 600 signals on their own candle from the total 80,000 signals, we know we definitely have enough clusters, so we’ll keep the 60-minute candles moving forward. We might even consider decreasing it.
Now how did the quality of buy signals differ between cluster sizes? We’ll explore different ways to measure cluster performance in the next post, but in the meantime, let’s just look at percent profitable.
Percent profitable: the number of profitable trades divided by the total number of trades — i.e., the probability of “winning”. When percent profitable is 50%, the number of winning trades is equal to the number of losing trades.
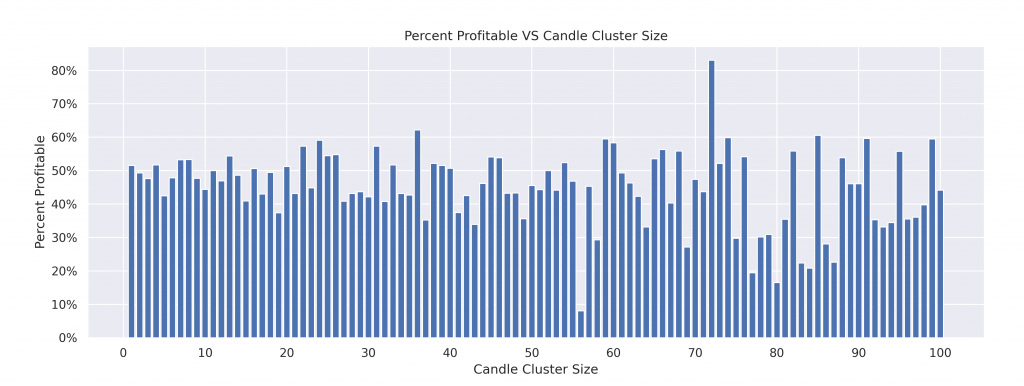
It’s glaringly obvious that we will not attain higher returns by blindly clustering buy signals. Just like with buying iPhones, not everyone’s decision to do so will be the right one, or at the right time. Instead, we’ll have to cluster systematically, finding specific trading strategies that synergize well and leveraging their specific strengths to generate higher returns.
What’s Next?
Today, we went over candles and how Tuned strategies trade on them, as well as my process to cluster buy signals: starting with selecting a candle size for clusters, then executing an algorithm to perform the clustering, and ending off with some initial results! In the next post, I’ll be finding groups of strategies that give higher profits when their buy signals are combined, and determining ways to measure their performance. Stay tuned!
Picture this: the new iPhone 17 Ultra Pro Max just dropped, and you’re debating whether or not to switch up your mobile device. The new …
Welcome back, data science fans!
Continuing from the second article, where I discussed the clustering of buy signals, we’re now ready to get into the meat …
And here we have it: the last installment of the data science article series! In our previous article, we created some correlated clusters and came …


