
- MACD triggers technical signals when it crosses above (to buy) or below (to sell) its signal line.
- The speed of crossovers is also taken as a signal of whether a market is overbought or oversold.
- MACD also helps investors understand whether the bullish or bearish movement in the price is strong or weak.
What Is Moving Average Convergence Divergence (MACD)?
Moving Average Convergence Divergence (MACD) is a trend-following momentum indicator that shows the relationship between two moving averages of an assets price. The MACD is calculated by subtracting the 26-period exponential moving average (EMA) from the 12-period EMA. The outcome of that calculation is the MACD line. A 9-period EMA of the MACD called the “Signal Line”, is then plotted on top of the MACD line, which can function as a trigger for buy and sell signals.

Key points about the MACD
How to add the MACD to my script?
Below you will find a short example of using the MACD in your script.
// Inputs
    // We will define 3 integer inputs, Fast line (12), Slow line (26)
    // and signal Line (9)
    fastLen = intInput("Fast Length", 12)
    slowLen = intInput("Slow Length", 26)
    signalLen = intInput("Signal Length", 9)
    src = close

//indicator
    // Define the MACD conditions
    fast_ma = ema(src, fastLen)
    slow_ma = ema(src, slowLen)
    macd = fast_ma - slow_ma
    signal = ema(macd, signalLen)
    hist = macd - signal

// Macd colors
    col_grow_above = seriesOf("#26A69A")
    col_grow_below = seriesOf("#FFCDD2")
    col_fall_above = seriesOf("#B2DFDB")
    col_fall_below = seriesOf("#EF5350")
    col_macd = seriesOf("#0094ff")
    col_signal = seriesOf("#ff6a00")

// Histogram Colors
    Histocolor = (iff(gte(hist, seriesOf(0.0)),
        (iff(lt(hist[1], hist), col_grow_above, col_fall_above)),
        (iff(lt(hist[1], hist), col_grow_below, col_fall_below))))

// Plot
    // Plot the MACD in 3 different lines
    plot(hist, "histogram", Histocolor, 4, PlotStyle.HISTOGRAM, 0, false)
    plot(macd, "macd line", col_macd, 1, PlotStyle.LINE, 0, false)
    plot(signal, "signal line", col_signal, 1, PlotStyle.LINE, 0, false)

// Signal Push
    // NEVER_ORDER means that no orders will be placed
    out(NEVER_ORDER)

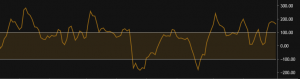
The above image is how the plot should look on the chart.
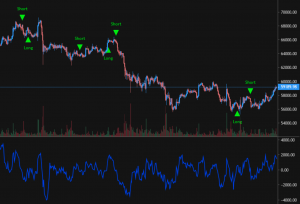
How to use the MACD to generate buy and sell signals?
For the example I will use the default settings, Fast Length = 12, Slow Length = 26 and Signal Length = 9
The most commonly used method for the MACD is to buy when the MACD line crosses up through the Signal Line, and to sell when the MACD line crosses down through the Signal Line.
This generally indicates a strong momentum change.
//Inputs
    // We will define 3 integer inputs, Fast line (12), Slow line (26),
    //and signal Line (9)
    fastLen = intInput("Fast Length", 12)
    slowLen = intInput("Slow Length", 26)
    signalLen = intInput("Signal Length", 9)
    src = close

//indicator
    // Define the MACD conditions
    fast_ma = ema(src, fastLen)
    slow_ma = ema(src, slowLen)
    macd = fast_ma - slow_ma
    signal = ema(macd, signalLen)
    hist = macd - signal

// Macd colors
    col_grow_above = seriesOf("#26A69A")
    col_grow_below = seriesOf("#FFCDD2")
    col_fall_above = seriesOf("#B2DFDB")
    col_fall_below = seriesOf("#EF5350")
    col_macd = seriesOf("#0094ff")
    col_signal = seriesOf("#ff6a00")

// Histogram Colors
    Histocolor = (iff(gte(hist, seriesOf(0.0)),
        (iff(lt(hist[1], hist), col_grow_above, col_fall_above)),
        (iff(lt(hist[1], hist), col_grow_below, col_fall_below))))

//Plot
    // Plot the MACD in 3 different lines
    plot(hist, "histogram", Histocolor, 4, PlotStyle.HISTOGRAM, 0, false)
    plot(macd, "macd line", col_macd, 1, PlotStyle.LINE, 0, false)
    plot(signal, "signal line", col_signal, 1, PlotStyle.LINE, 0, false)

// Entry and Exit conditions
    // Define the entry of the macd line crossing over the signal line
    buy = crossover(macd, signal)

    // Define the entry of the macd line crossing under the signal line
    sell = crossunder(macd, signal)

//Signal Push
    // Here you will output your Entry and Exit signals
    out(signalIf(buy, sell))
Below is a screenshot of how your chart should look

So now you have learnt what MACD is, how to use it and how to put it in a script and generate signals from it.
Have fun scripting!
In this article, we’ll be talking about the Momentum indicator.We’ll be exploring what it does, its common uses and how it can be applied to …
Table of Contents:
What is overfitting?How do I avoid overfitting?
For the investors reading this article, you can skip ahead to “What is Overfitting?”
By this point you …

Table of contents:
What is the Fibonacci sequence?The golden mean in our behaviorIn practice
In May 2021, Dogecoin (DOGE) entered the hall of fame when it topped …
What is the Commodity Channel Index (CCI)?Key points about the CCIHow to add the CCI to my script?How to use the CCI to generate buy …


