
Disclaimer: The opinions expressed here are for general informational purposes only and are not intended to provide specific advice or recommendations for any specific security or investment product. You should never invest money that you cannot afford to lose. Before trading using complex financial products, please ensure to understand the risks involved. Past performance is no guarantee of future results.
In this article, we’ll be exploring what Bollinger Bands® are, what they do, common uses and how they can be applied to Tuned and algorithmic trading in general.
Table of contents
- What are Bollinger Bands®?
- How are Bollinger Bands® calculated?
- Common uses
- An example strategy using Bollinger Bands® on Tuned
- Conclusion
What are Bollinger Bands®?
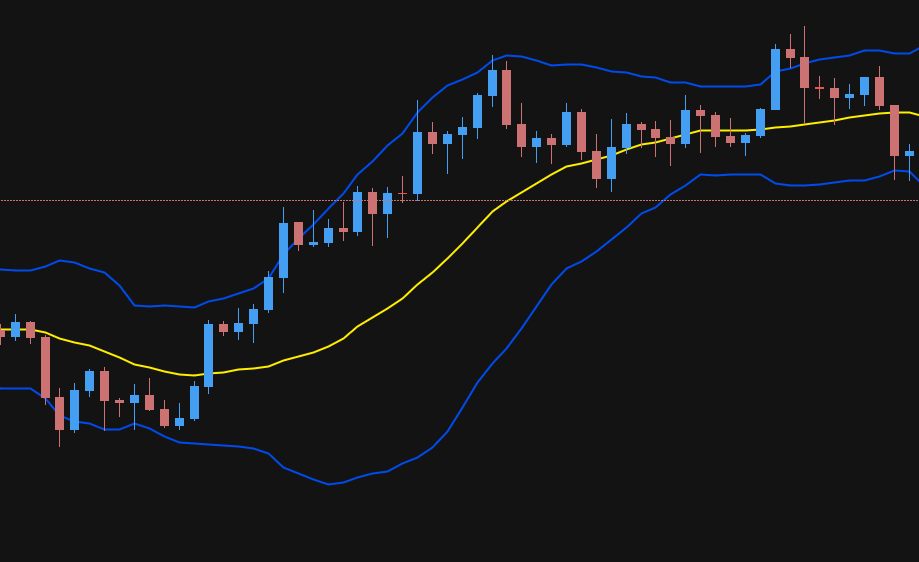
Bollinger Bands® were developed by John Bollinger in the 1980s and are a technical indicator to plot standard deviations around a moving average. The bands measure volatility and are used to create context and structure around the assets’ price. The bands widen as volatility increases and tighten when volatility decreases. When the bands tighten, constricting the Moving Average, this is often referred to as ‘Squeeze’. Wider bands generally imply a higher deviation, this means that the average price is less likely to be closer to the mean.
The Bollinger Bands® are an overlay indicator, this means the indicator is plotted on top of the price candles.
How are Bollinger Bands® calculated?
The formula is made of 2 parts:
- The center line. This is by default a Simple Moving Average with a period of 20.
- The upper and lower bands. This is by default 2.0 x standard deviation from the mean.
For the Moving Average the formula is as follows:
SMA = ( Sum ( Price, n ) ) / n
Where: n = Period
For the Upper and Lower bands we first need to know how to calculate the standard deviation. The formula for this is:
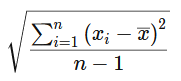
Now that we know the formula for standard deviation, we can continue with calculating the upper and lower band.
Upper Band = 20-period SMA + (20-period standard deviation of Price x 2.0)
Lower Band = 20-period SMA – (20-period standard deviation of Price x 2.0)
Common uses
Traders believe that depending on how close the price moves towards the upper band, the more overbought the market is, and how close the price moves towards the lower band, the more oversold the market is. The Bollinger Bands® indicator is widely used among traders.
So what do they actually indicate?
- Tightening bands indicates a drop in market volatility and can indicate a ‘squeeze’
- Widening bands indicates an increase in market volatility
- Candles close to upper band could indicate an overbought market
- Candles close to lower band could indicate an oversold market
While Bollinger Bands® on their own provide multiple different factors of the market’s sentiment; like volatility, trend direction and market momentum, combining it with other indicators can increase the success rate of the strategy.
An example strategy using Bollinger Bands® on Tuned
The code is as follows:
Tuned Script
//Inputs
period = intInput("Period", 20)
mult = numInput("Band Multiplier", 2.0)

//indicator
middleBand = sma(close, period)
stdDev = mult * stdev(close, period)
upperBand = middleBand + stdDev
lowerBand = middleBand - stdDev

//Conditions
buy = crossover(close, lowerBand)
sell = crossunder(close, upperBand)

//Plot
plot(upperBand, "Upper Band", "#004BEC", 2)
plot(middleBand, "Middle Band", "#FFEE00", 2)
plot(lowerBand, "Lower Band", "#004BEC", 2)

//Signal Push
out(signalIf(buy, sell))
Pine Alpha
strategy(title="Bollinger Bands", overlay = true)
//Inputs
period = input(title = "Period", defval = 20)
mult = input(title = "Band Multiplier", defval = 2.0)
//indicator
middleBand = sma(close, period)
stdDev = mult * stdev(close, period)
upperBand = middleBand + stdDev
lowerBand = middleBand - stdDev
//Conditions
buy = crossover(close, lowerBand)
sell = crossunder(close, upperBand)
//Plot
plot(upperBand, title = "Upper Band", color = #004BEC, linewidth = 2)
plot(middleBand, title = "Middle Band", color = #FFEE00, linewidth = 2)
plot(lowerBand, title = "Lower Band", color = #004BEC, linewidth = 2)
//Signal Push
if buy
strategy.order("Buy", strategy.long)
if sell
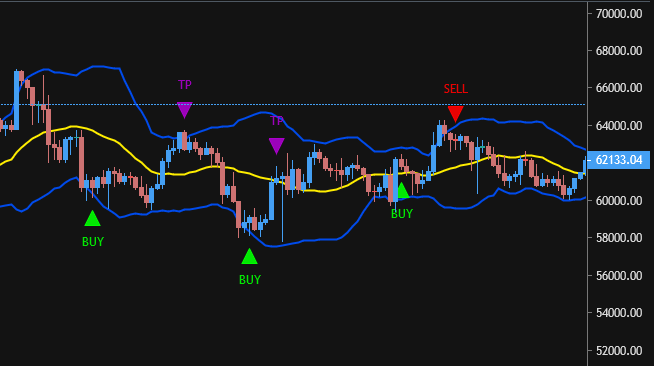
strategy.close("Sell")The strategy above revolves around buying when the market returns from being oversold and selling when it returns from being overbought. This is done by using a crossover of either the lower band or crossunder of the upper band.
How does it behave?
- During strong up trending markets the price will likely stay close to or above the upper band.
- During strong down trending markets the price will likely stay close to or below the lower band.
- In a ranging market the price will stay closer to the mean.
- In periods of high volatility the bands will expand.
Conclusion
Bollinger Bands® can be a powerful indicator on their own as it shows you multiple market conditions. However, trying to combine them with other indicators may further improve your success rate. We hope this article helped you understand the concepts and functionalities of Bollinger Bands® and allow you to use them to improve your success!
Have fun scripting!


