
- The RSI is a very popular momentum oscillator
- The RSI provides bullish and bearish momentum signals
- Usually considered overbought when the RSI is above 70.0 and oversold when below 30.0 (default settings)
What Is the Relative Strength Index (RSI)?
The relative strength index (RSI) is a momentum indicator used in technical analysis that measures the magnitude of recent price changes to evaluate overbought or oversold conditions in the price of a stock or other asset. The RSI is displayed as an oscillator (a line graph that moves between two extremes) and can have a reading of 0 to 100.

Key points about the RSI
How to add the RSI to your script?
Below you will find a short example of using the RSI in your script.
//Inputs
    // Create the input variable for the Length using an intInput
    rsiLen = intInput("RSI Length", 14)

    // Create the input variable for the overbought/oversold using a numInput
    upper = numInput("Overbought Level", 70.0)
    lower = numInput("Oversold Level", 30.0)

//indicator
    // Define the RSI using the candle CLOSE and the rsiLen Input
    RSI = rsi(close, rsiLen)

//Plot
    // Plot the RSI and the upper and lower threshold
    plot(RSI, "RSI", "#E45CFF", 2, PlotStyle.LINE, 0, false)
    plot(seriesOf(upper), "RSI upper", "#ffffff", 1, PlotStyle.LINE, 0, false)
    plot(seriesOf(lower), "RSI upper", "#ffffff", 1, PlotStyle.LINE, 0, false)

//Signal Push
    out(NEVER_ORDER)

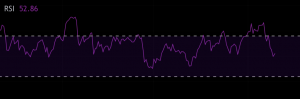
The above image is how the plot should look on the chart. The pink line is the RSI line, and the 2 horizontal lines are the overbought and oversold areas.
How to use the RSI to generate buy and sell signals?
For the example I will use the default settings: Length = 14, overbought = 70.0, oversold = 30.0
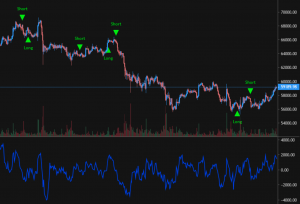
The most commonly used method for the RSI, is to buy when the RSI crosses up through the oversold threshold, and to sell when the RSI crosses down through the overbought threshold.
This generally indicates a strong momentum change.
//Inputs
    // Create the input variable for the Length using an intInput
    rsiLen = intInput("RSI Length", 14)

    // Create the input variable for the overbought/oversold using a numInput
    upper = numInput("Overbought Level", 70.0)
    lower = numInput("Oversold Level", 30.0)

//indicator
    // Define the RSI using the candle CLOSE and the rsiLen Input
    RSI = rsi(close, rsiLen)

//Plot
    // Plot the RSI and the upper and lower threshold
    plot(RSI, "RSI", "#E45CFF", 2, PlotStyle.LINE, 0, false)
    plot(seriesOf(upper), "RSI upper", "#ffffff", 1, PlotStyle.LINE, 0, false)
    plot(seriesOf(lower), "RSI upper", "#ffffff", 1, PlotStyle.LINE, 0, false)

//Entry and Exit Conditions
    // Define the Entry condition of RSI crossing over the Lower Threshold
    buy = crossover(RSI, seriesOf(lower))

    // Define the Exit condition of RSI crossing under the upper Threshold
    sell = crossunder(RSI, seriesOf(upper))

//Signal Push
    // Here you will output your Entry and Exit signals
    out(signalIf(buy, sell))
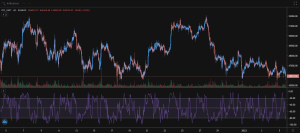
Below is a screenshot of how your chart should look:

So now you have learnt what the RSI is, how to use it and how to put it in a script and generate signals from it.
Have fun scripting!
In this article, we’ll be talking about the Momentum indicator.We’ll be exploring what it does, its common uses and how it can be applied to …
What Is the Relative Strength Index (RSI)?
The relative strength index (RSI) is a momentum indicator used in technical analysis that measures the magnitude of recent …
We’ll be talking about the Williams %R indicator in this article.
We will look at what it does, how it’s used, and how it can be …
Our previous blog post, The Rise of the Independent Trader, talked about a plan to level the playing field between Wall Street and Main Street. …


